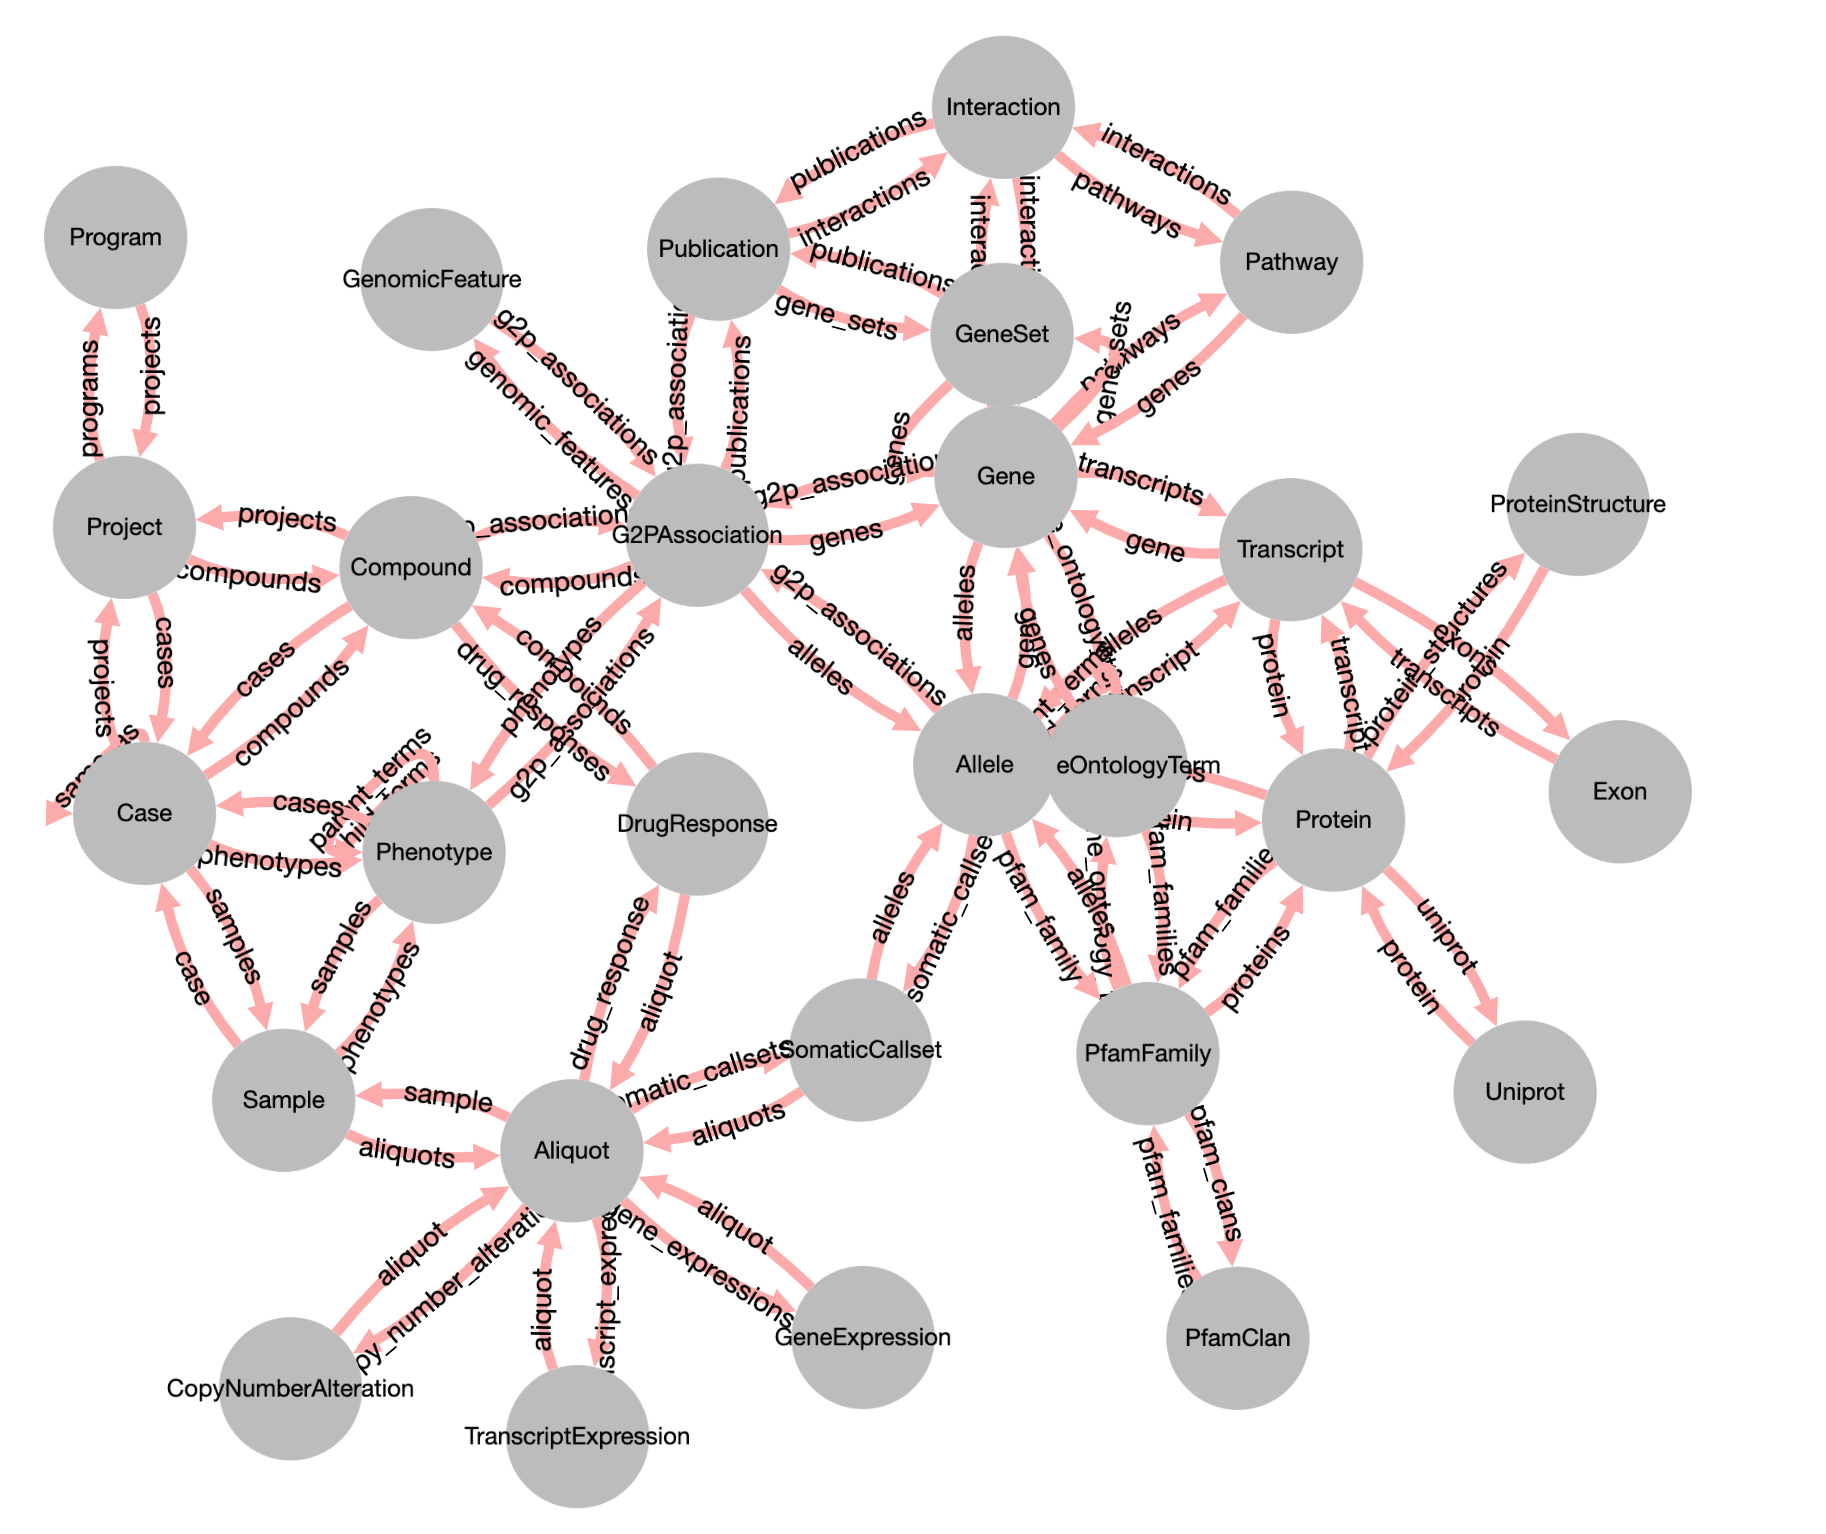
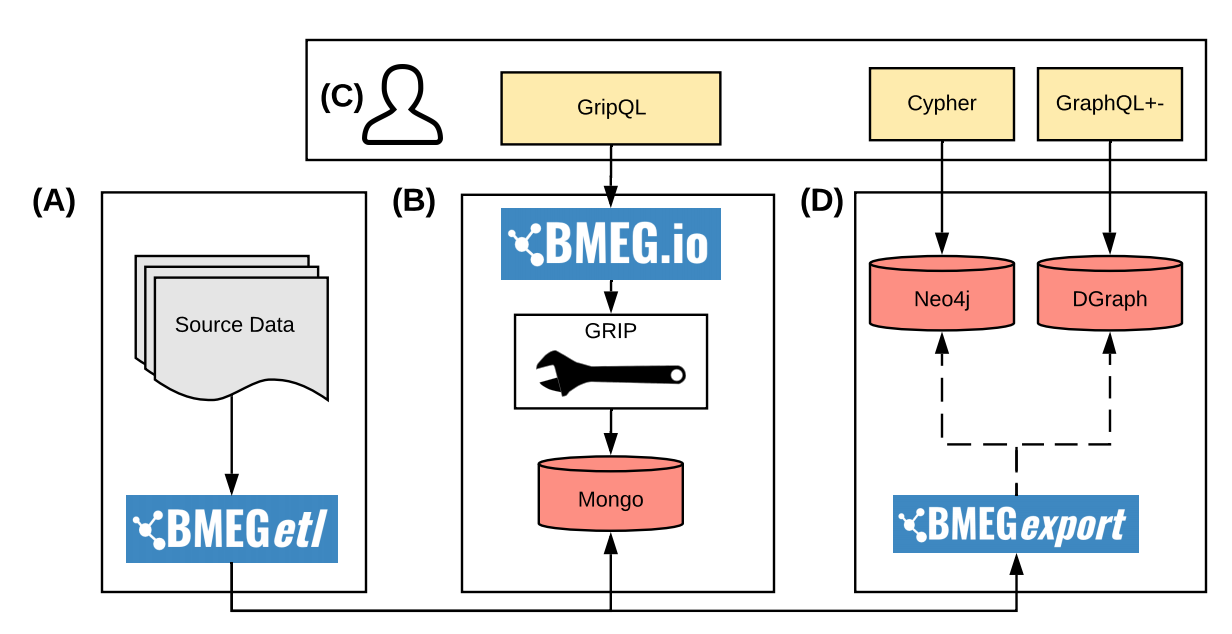
The analysis of cancer biology data involves extremely heterogeneous datasets including information from RNA sequencing, genome-wide copy number, DNA methylation data reporting on epigenomic regulation, somatic mutations from whole-exome or whole-genome analyses, pathology estimates from imaging sections or subtyping, drug response or other treatment outcomes, and various other clinical and phenotypic measurements. Bringing these different resources into a common framework, with a data model that allows for complex relationships as well as dense vectors of features, will unlock integrative analysis. We introduce a graph database and query engine for discovery and analysis of cancer biology, called the BioMedical Evidence Graph (BMEG). The BMEG is unique from other biological data graphs in that sample level molecular information is connected to reference knowledge bases. It combines gene expression and mutation data, with drug response experiments, pathway information databases and literature derived associations. The construction of the BMEG has resulted in a graph containing over 36M vertices and 29M edges. The BMEG system provides a graph query based API to enable analysis, with client code available for Python, Javascript and R, and a server online at bmeg.io. Using this system we have developed several forms of integrated analysis to demonstrate the utility of the system. The BMEG is an evolving resource dedicated to enabling integrative analysis. We have demonstrated queries on the system that illustrate mutation significance analysis, drug response machine learning, patient level knowledge base queries and pathway level analysis. We have compared the resulting graph to other available integrated graph systems, and demonstrated that it is unique in the scale of the graph and the type of data it makes available.